Introduction
An attacker will try to brute force into my virtual machine. I will get their information, such as geographical data and ip address. Then, I will send this information to Azure. Through Sentinel Workbook, a widget will be created of a worldwide map to showcase these attackers’ attempts. Essentially, my virutal machine will act as a honepot and I’m able to monitor the login attempts.
Configuration
Virtual Machine
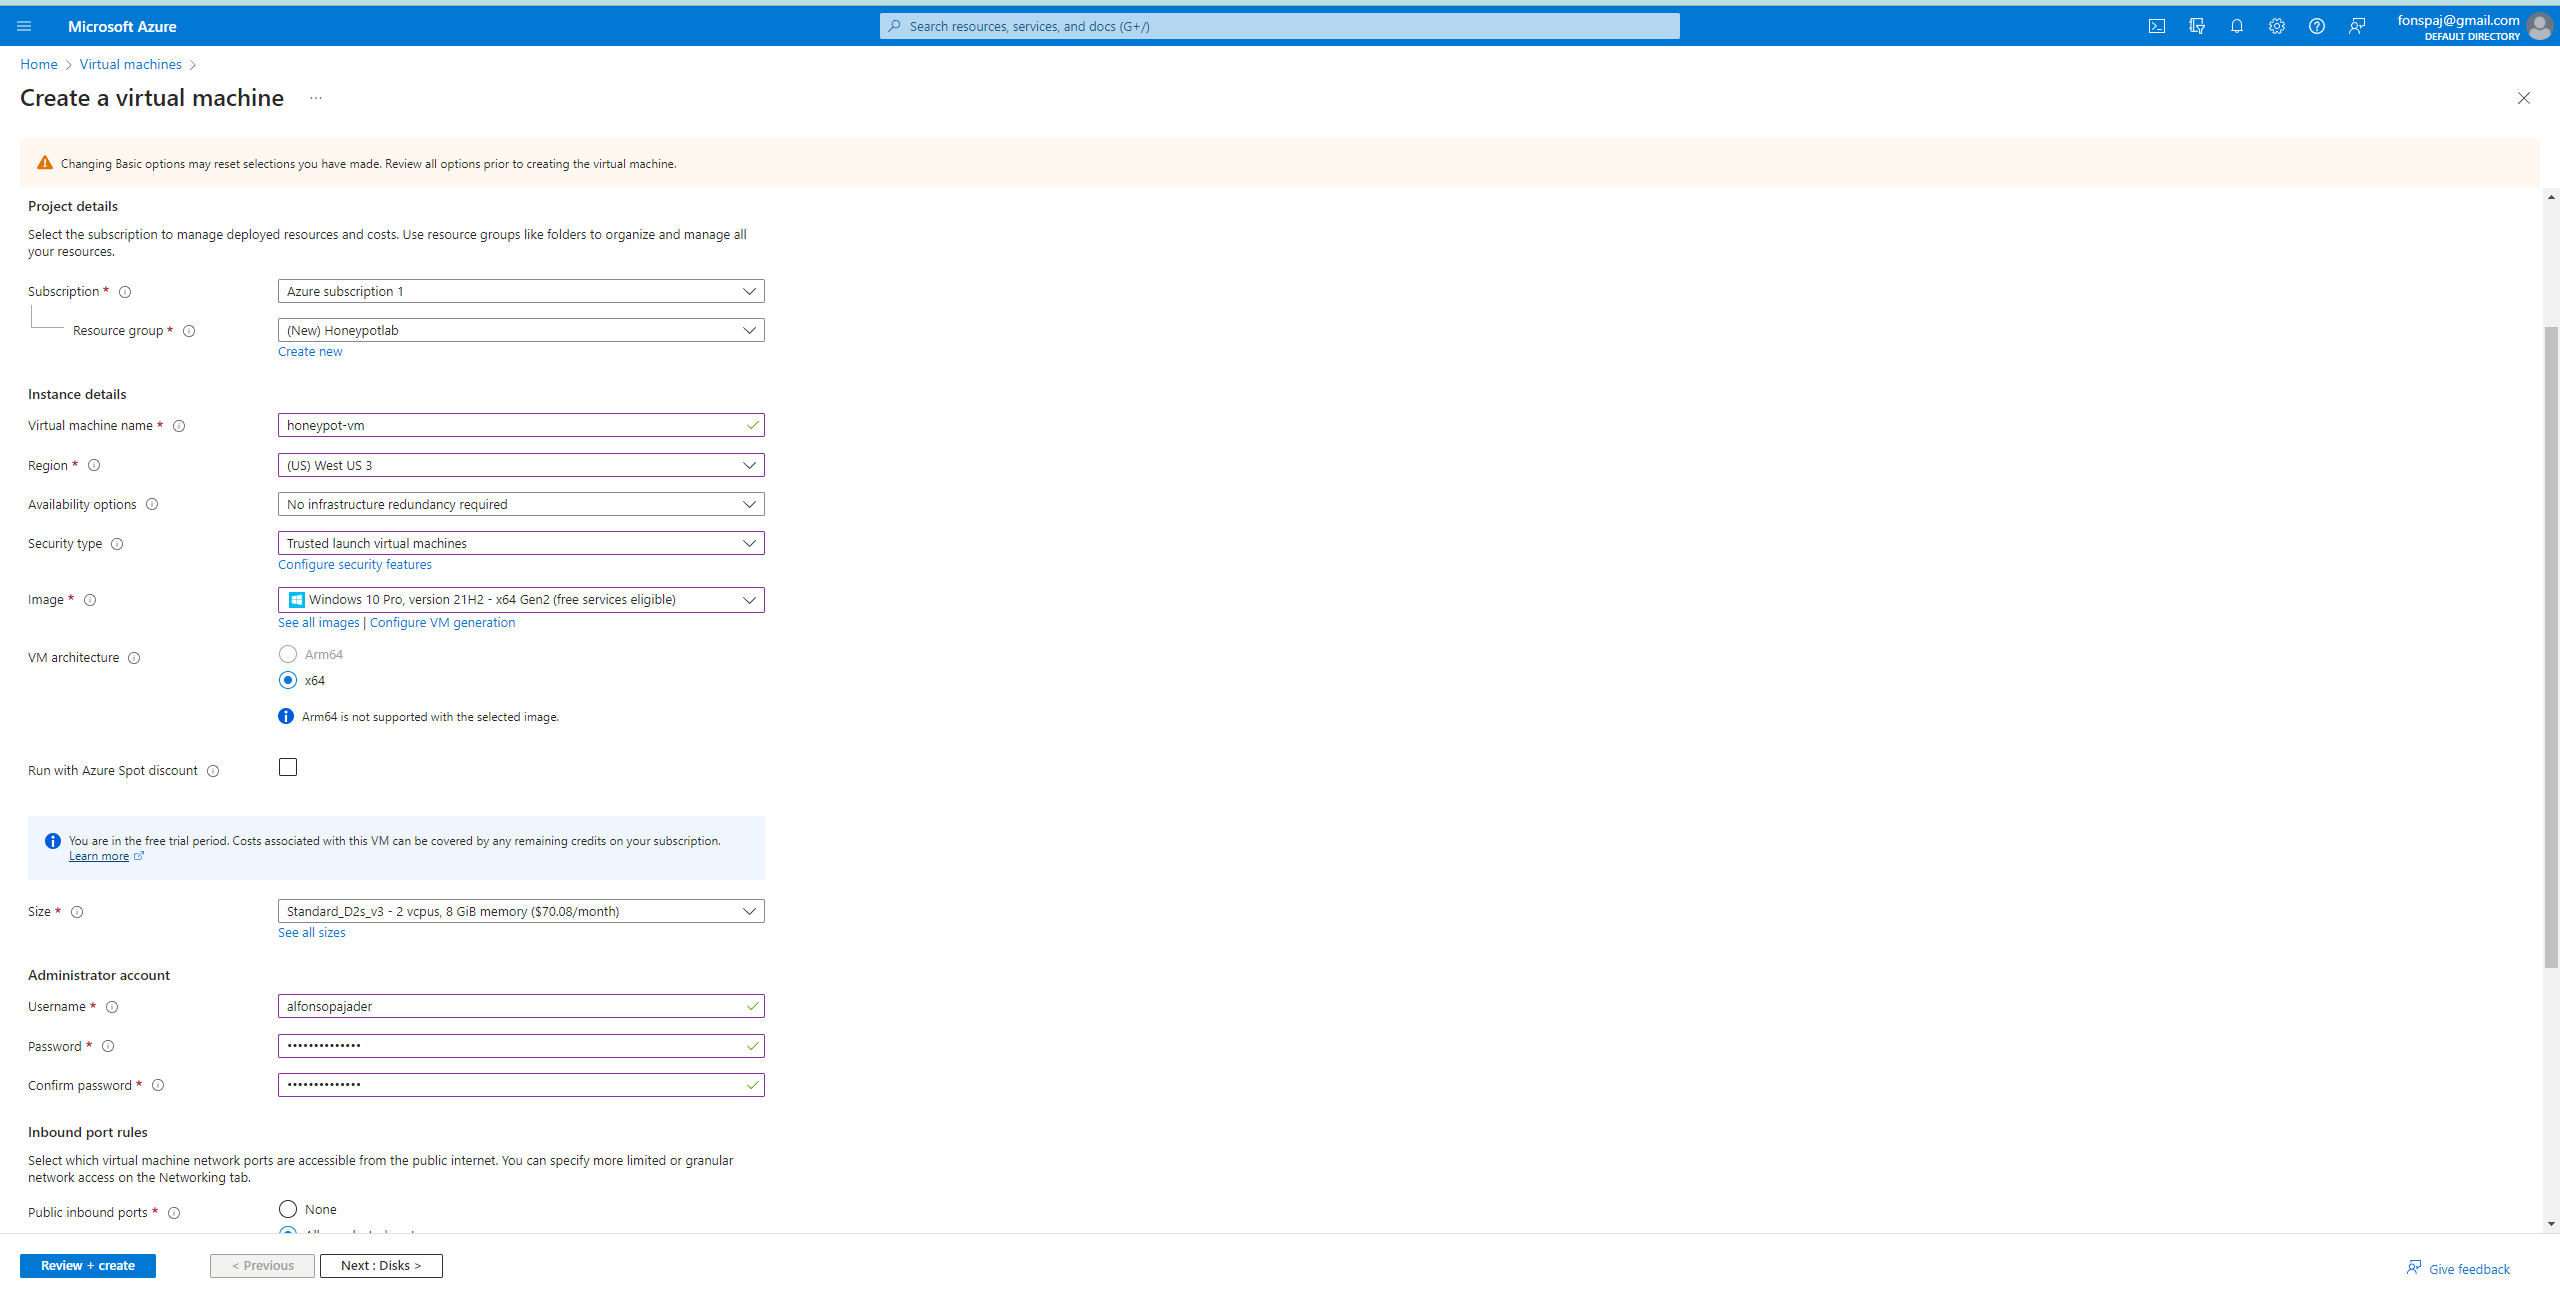
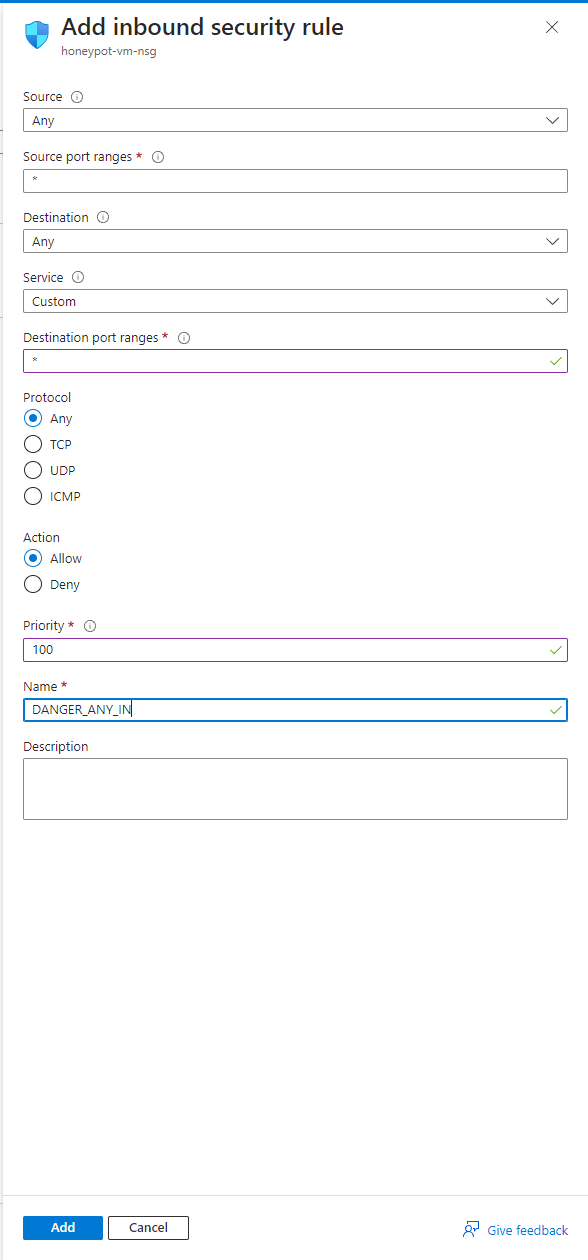
First, I created a VM with a Windows 10 image. In the VM’s network settings, I removed the default firewall to add a custom security rule. This security rule will allow my VM to be exposed and easily accessible.
Log Analytics Workspace
By creating this log analytics workspace, I am able to ingest the logs from the VM.
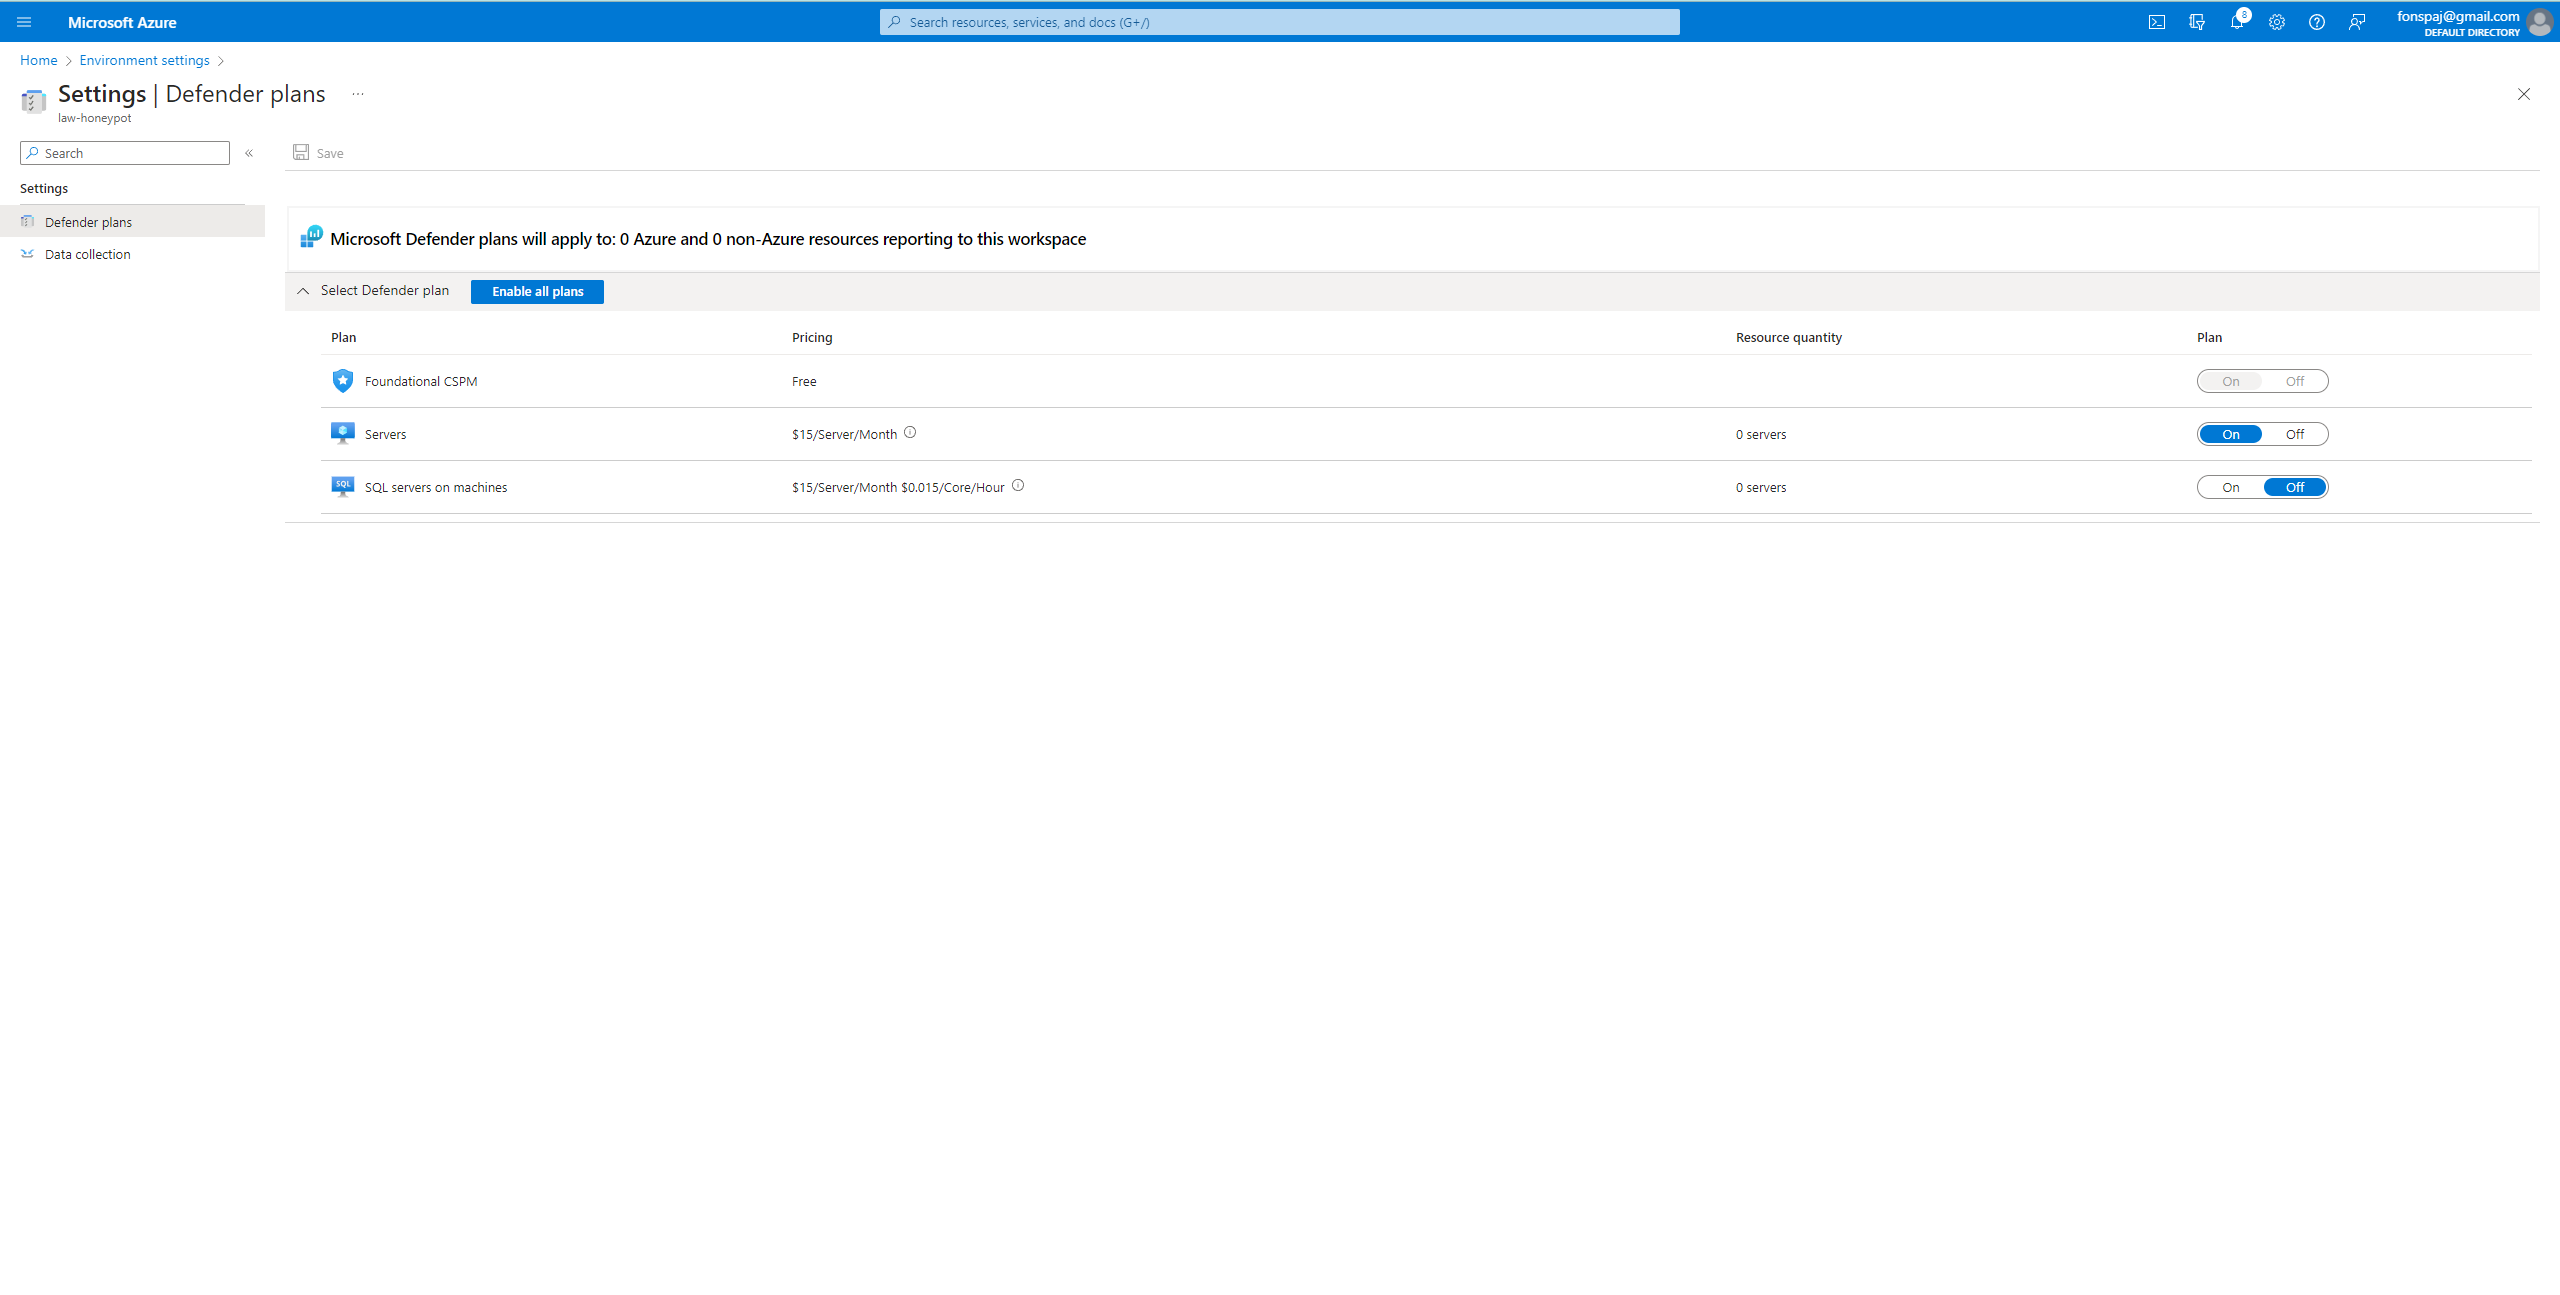
I accessed the workspace in Microsoft Defender -> Environmental Settings -> ‘workspace’
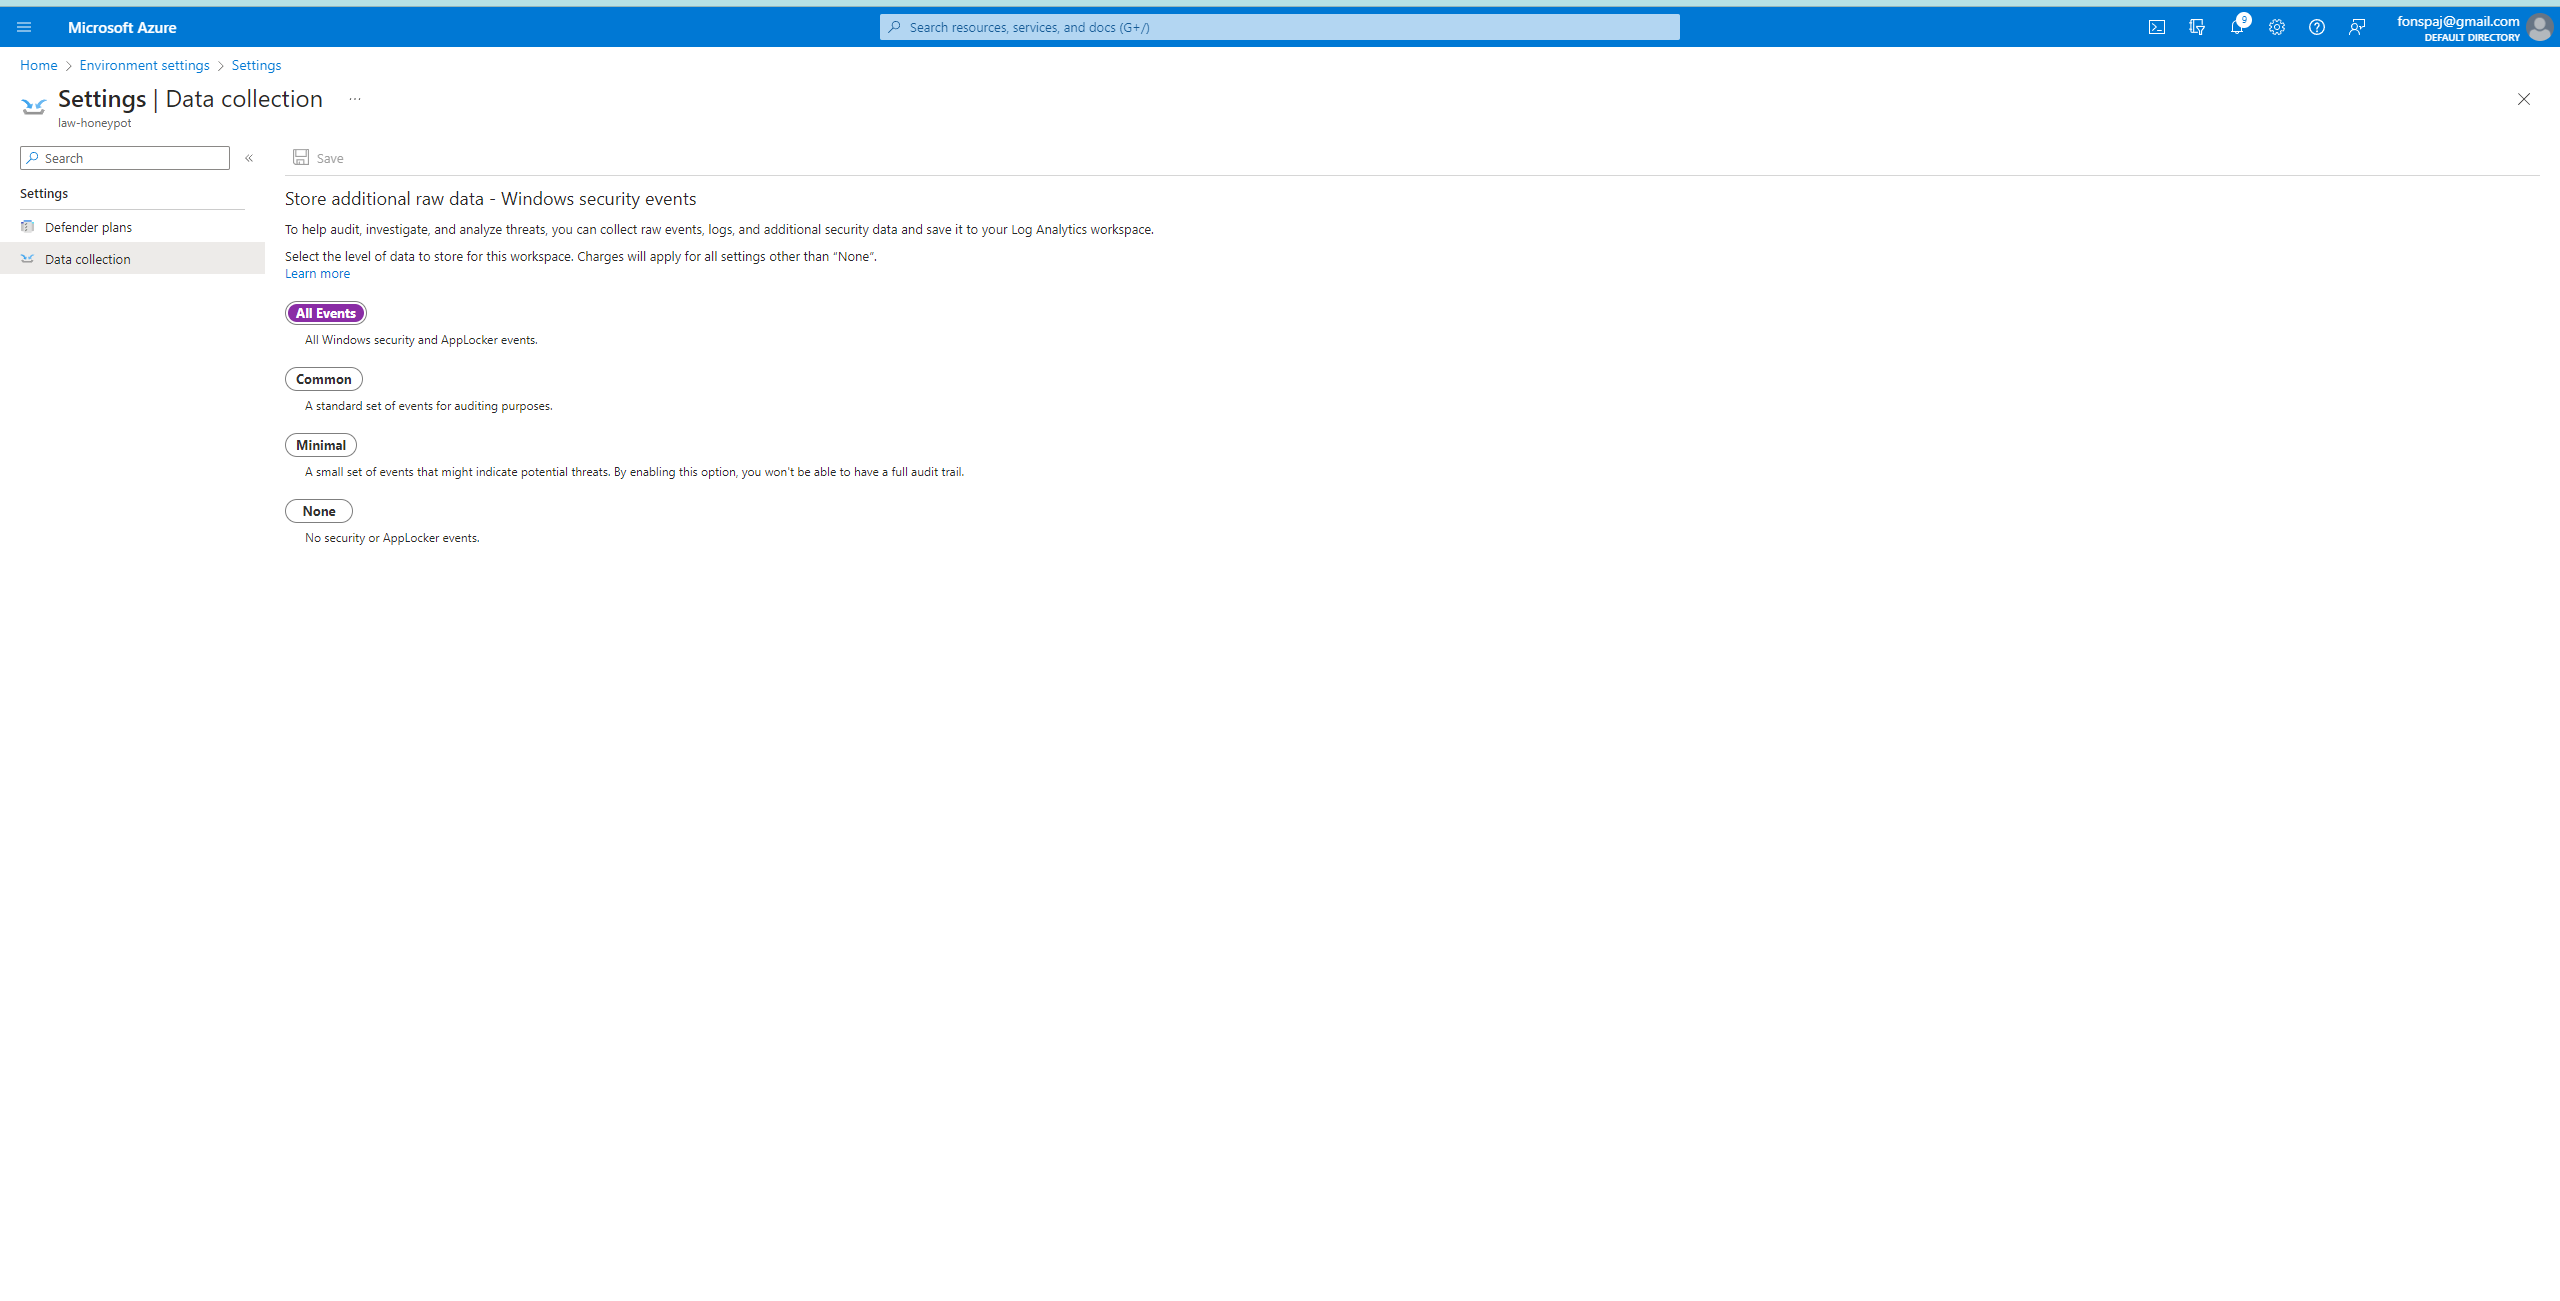
I made sure the servers were on and it’s able to collect all the data.
 IMPORTANT: After creating the LAW, connect it to the created VM.
Remote Desktop
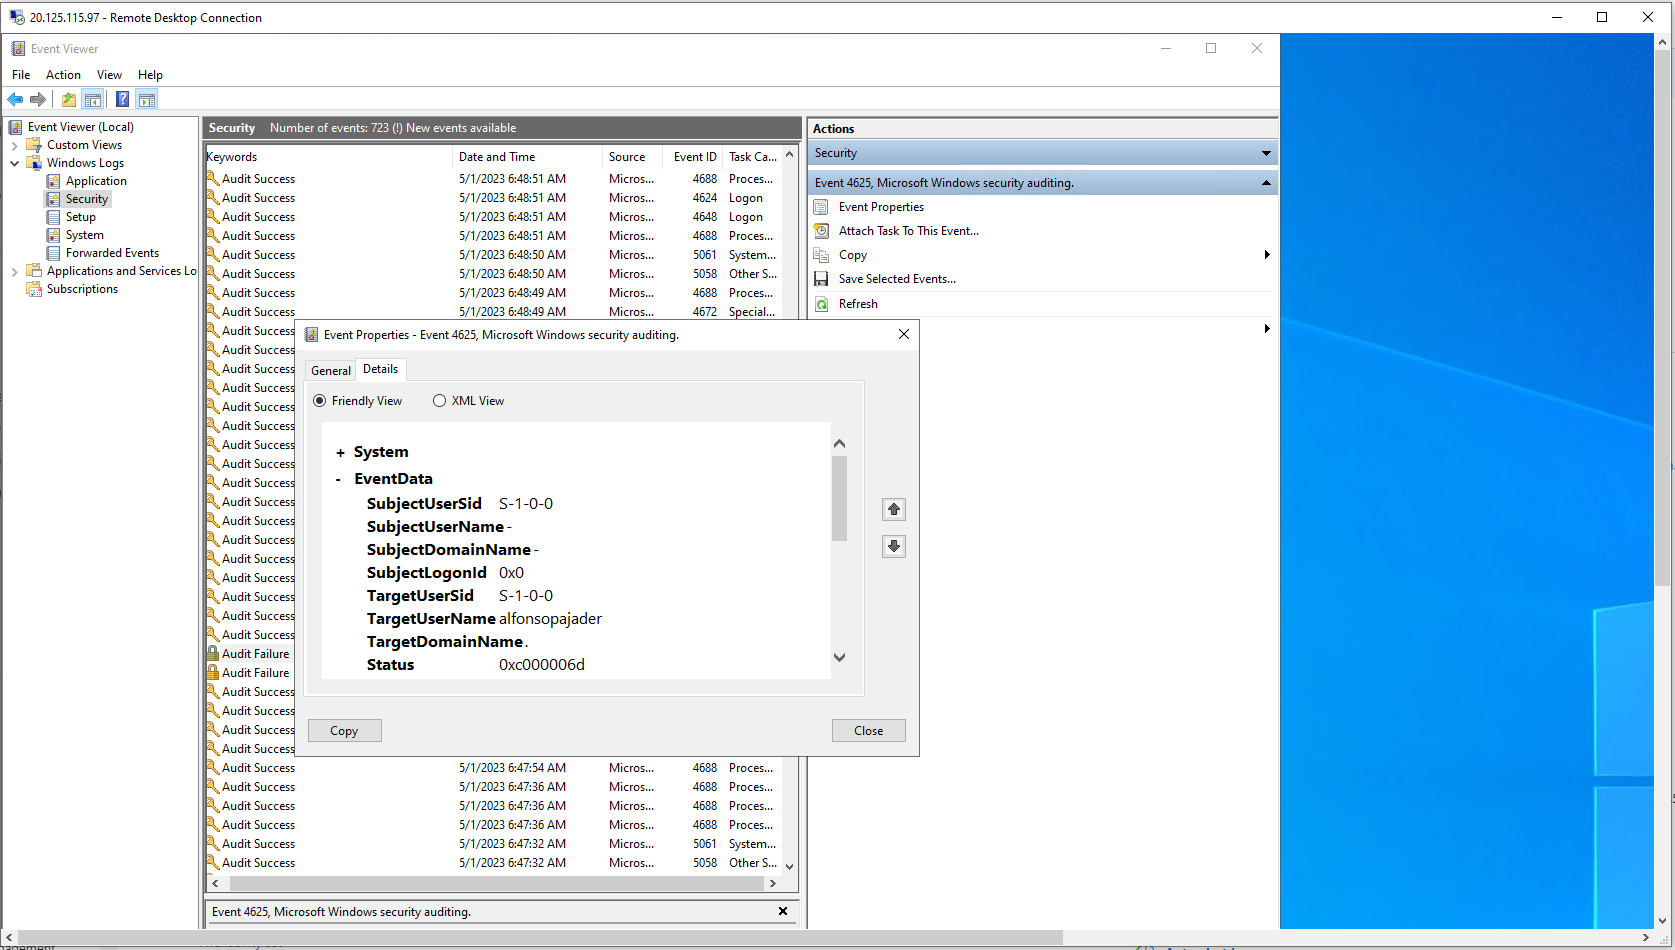
I connected to my VM by using the RDP application. At first, I inputted two false credentials and signed in with my appropriate username and password. Within the VM, I opened the Event Viewer to see the Windows Logs of my login attempts. From the picture below, it shows the details of the failed login attempt: Event 4625.
Everything was turned off in Windows Firewall, and I could test the VM by pinging it from outside.
I then, opened PowerShell ISE and ran a script to just showcase the failed attempts. IPGeolocation was used for API section of the script. It gets the geographical details from the logs. Now, I am able to grab IP address and geographical location from the failed event log. Running the script will create a failed_rdp file which will be used
Log Handling
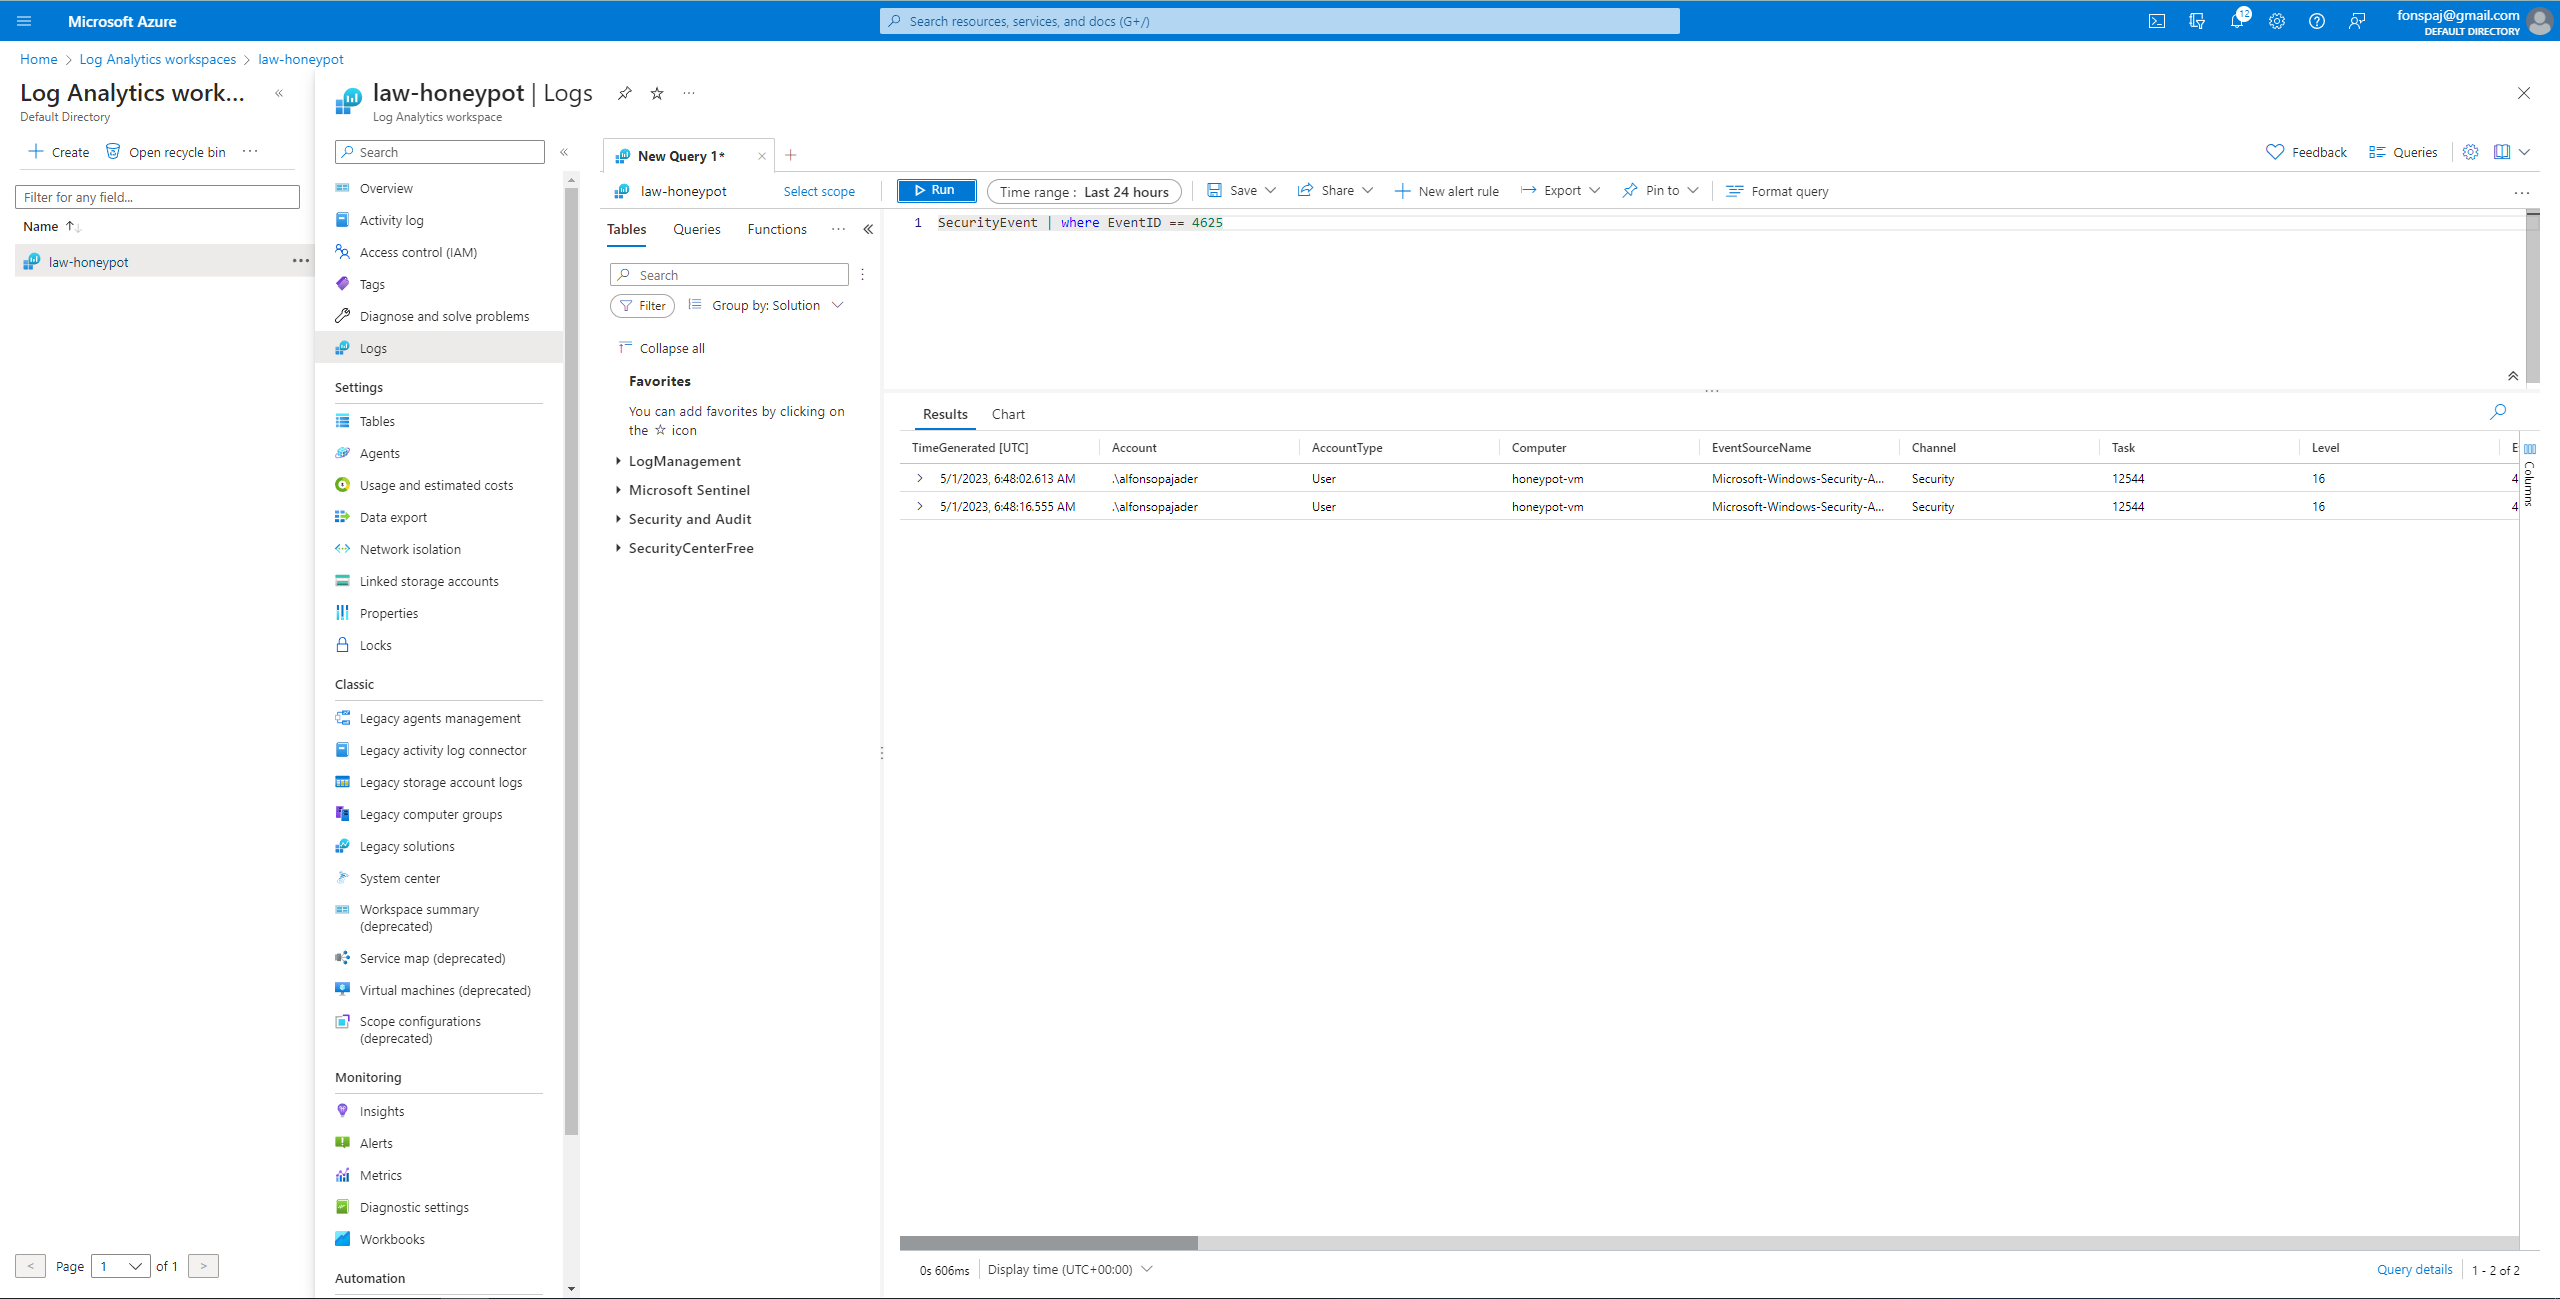
Within the LAW, created a MMA-based custom log. I used the file and its file path from the previous section. Input the name of the custom log and run the query. The picture below, shows a different query as I was waiting for the custom log to initialize. It took roughly 10-15 minutes for the custom to output logs.
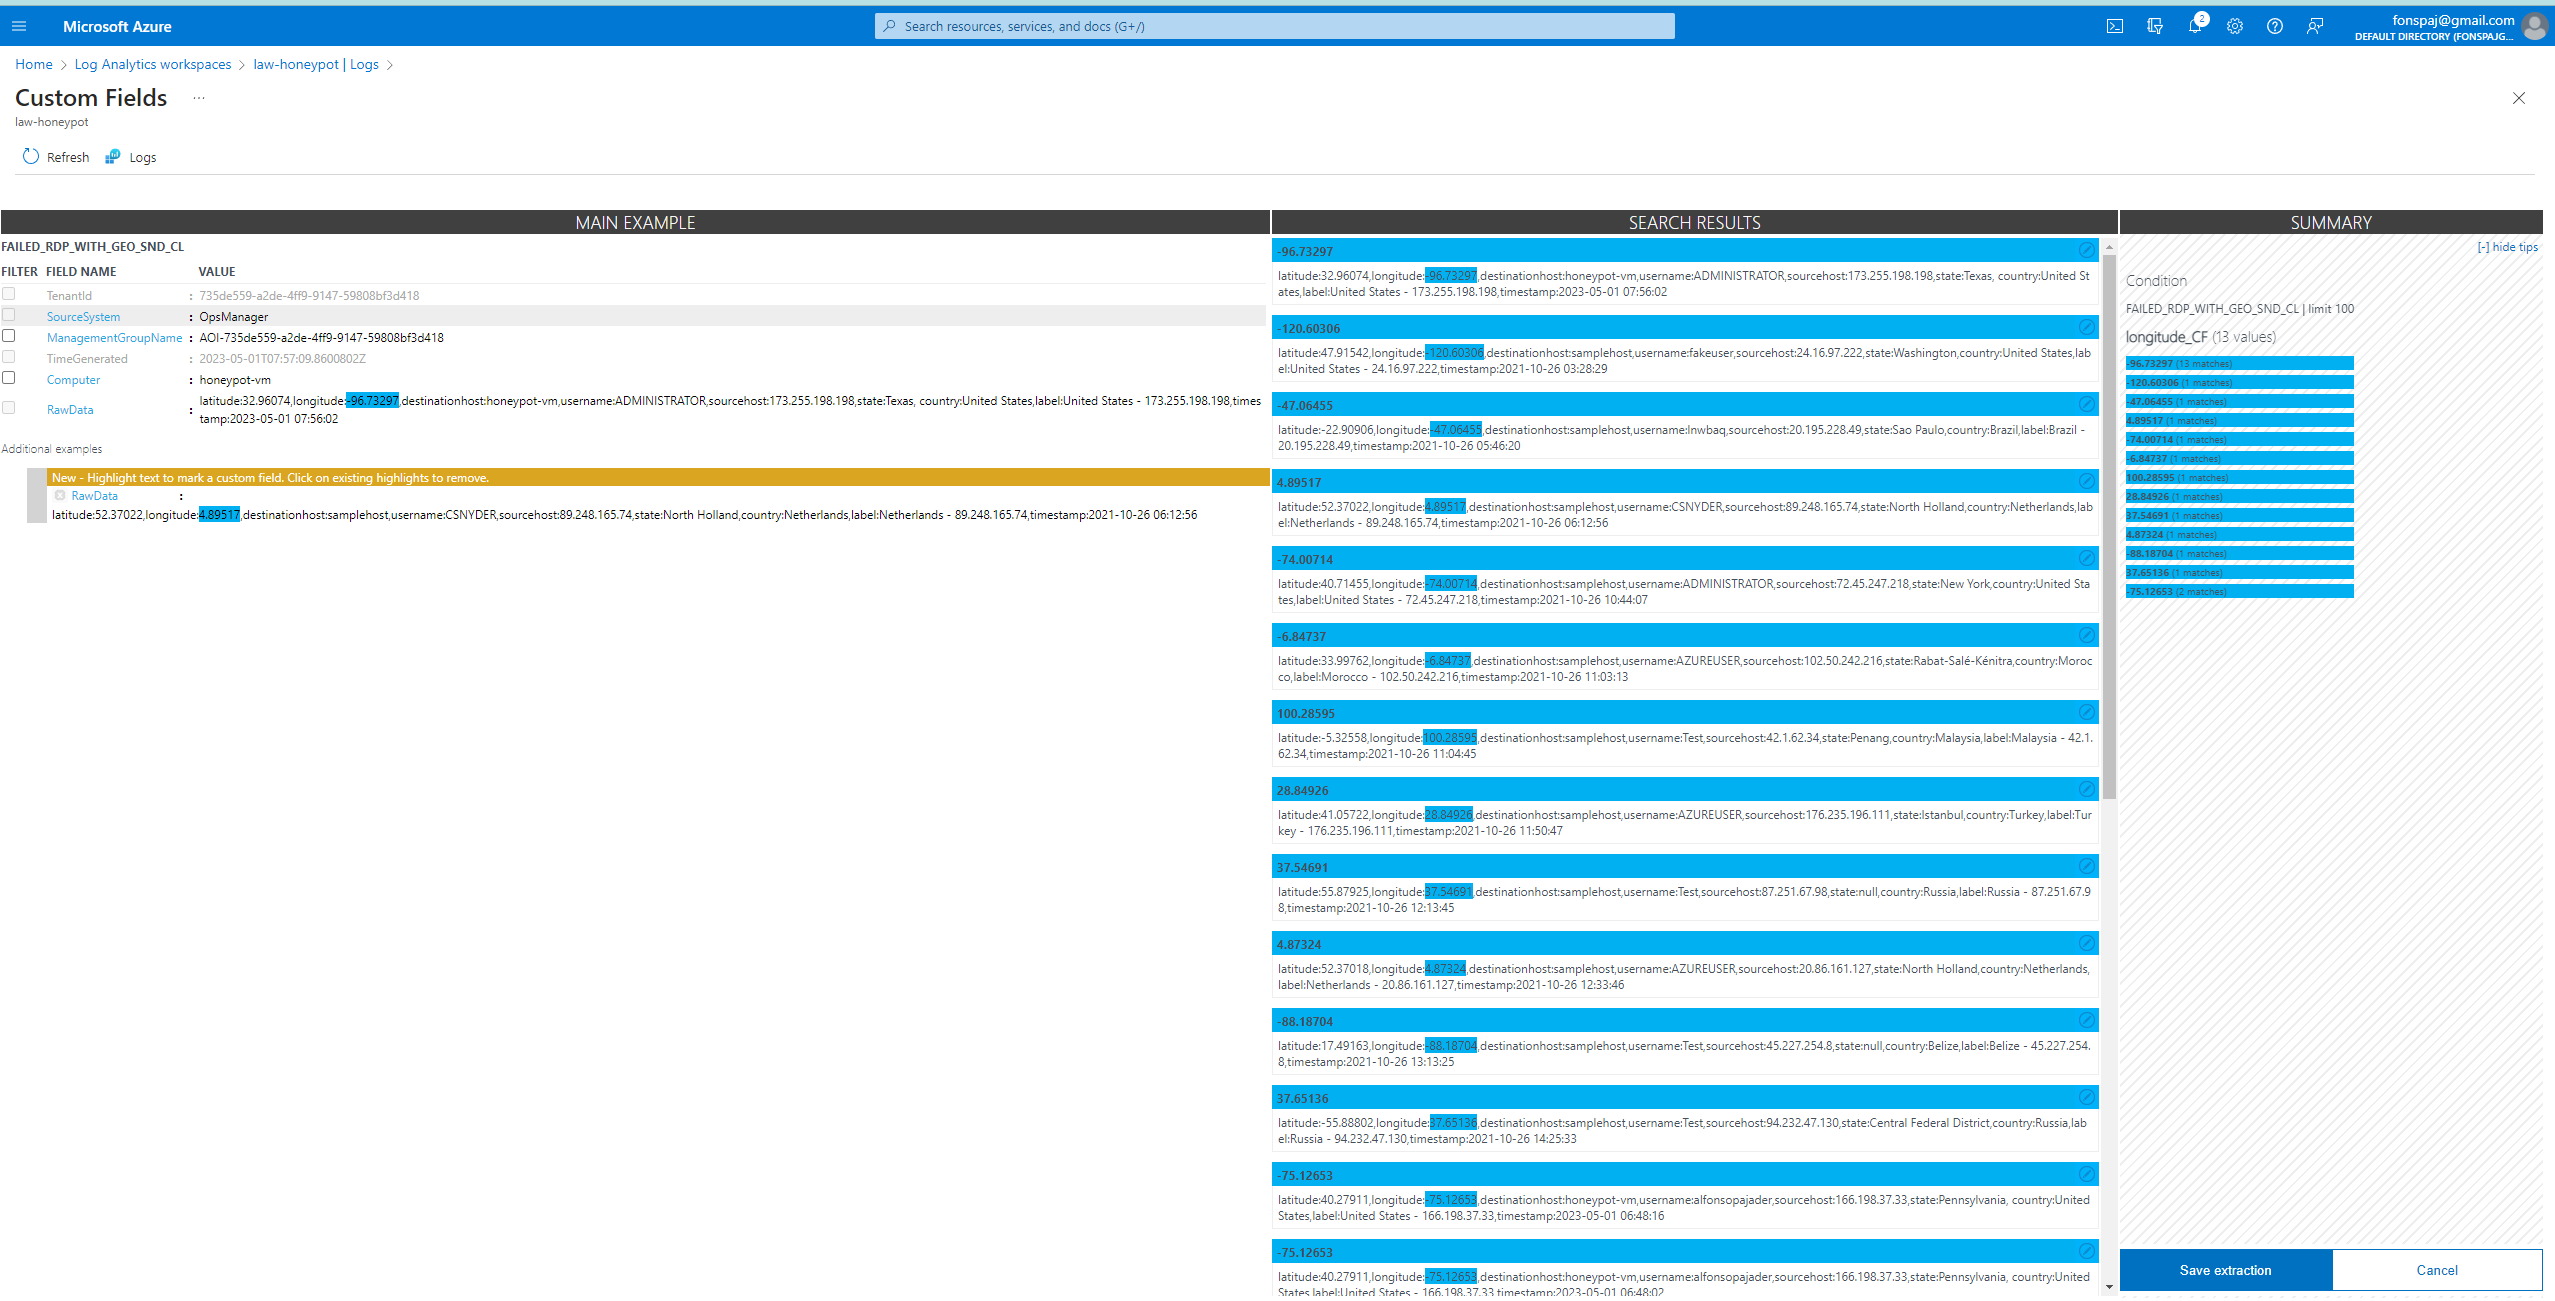
From one of the outputs, I focused on the raw data and ’extractted’ it. I needed to extract certain items so they can become custom fields. Make sure to the highlights align with what you’re trying to extract. If the extraction is different, modify it so the results are appropriate. After awhile, test out the query again by failing a login attempt. If the colums are not visible, filter them from the right hand side.
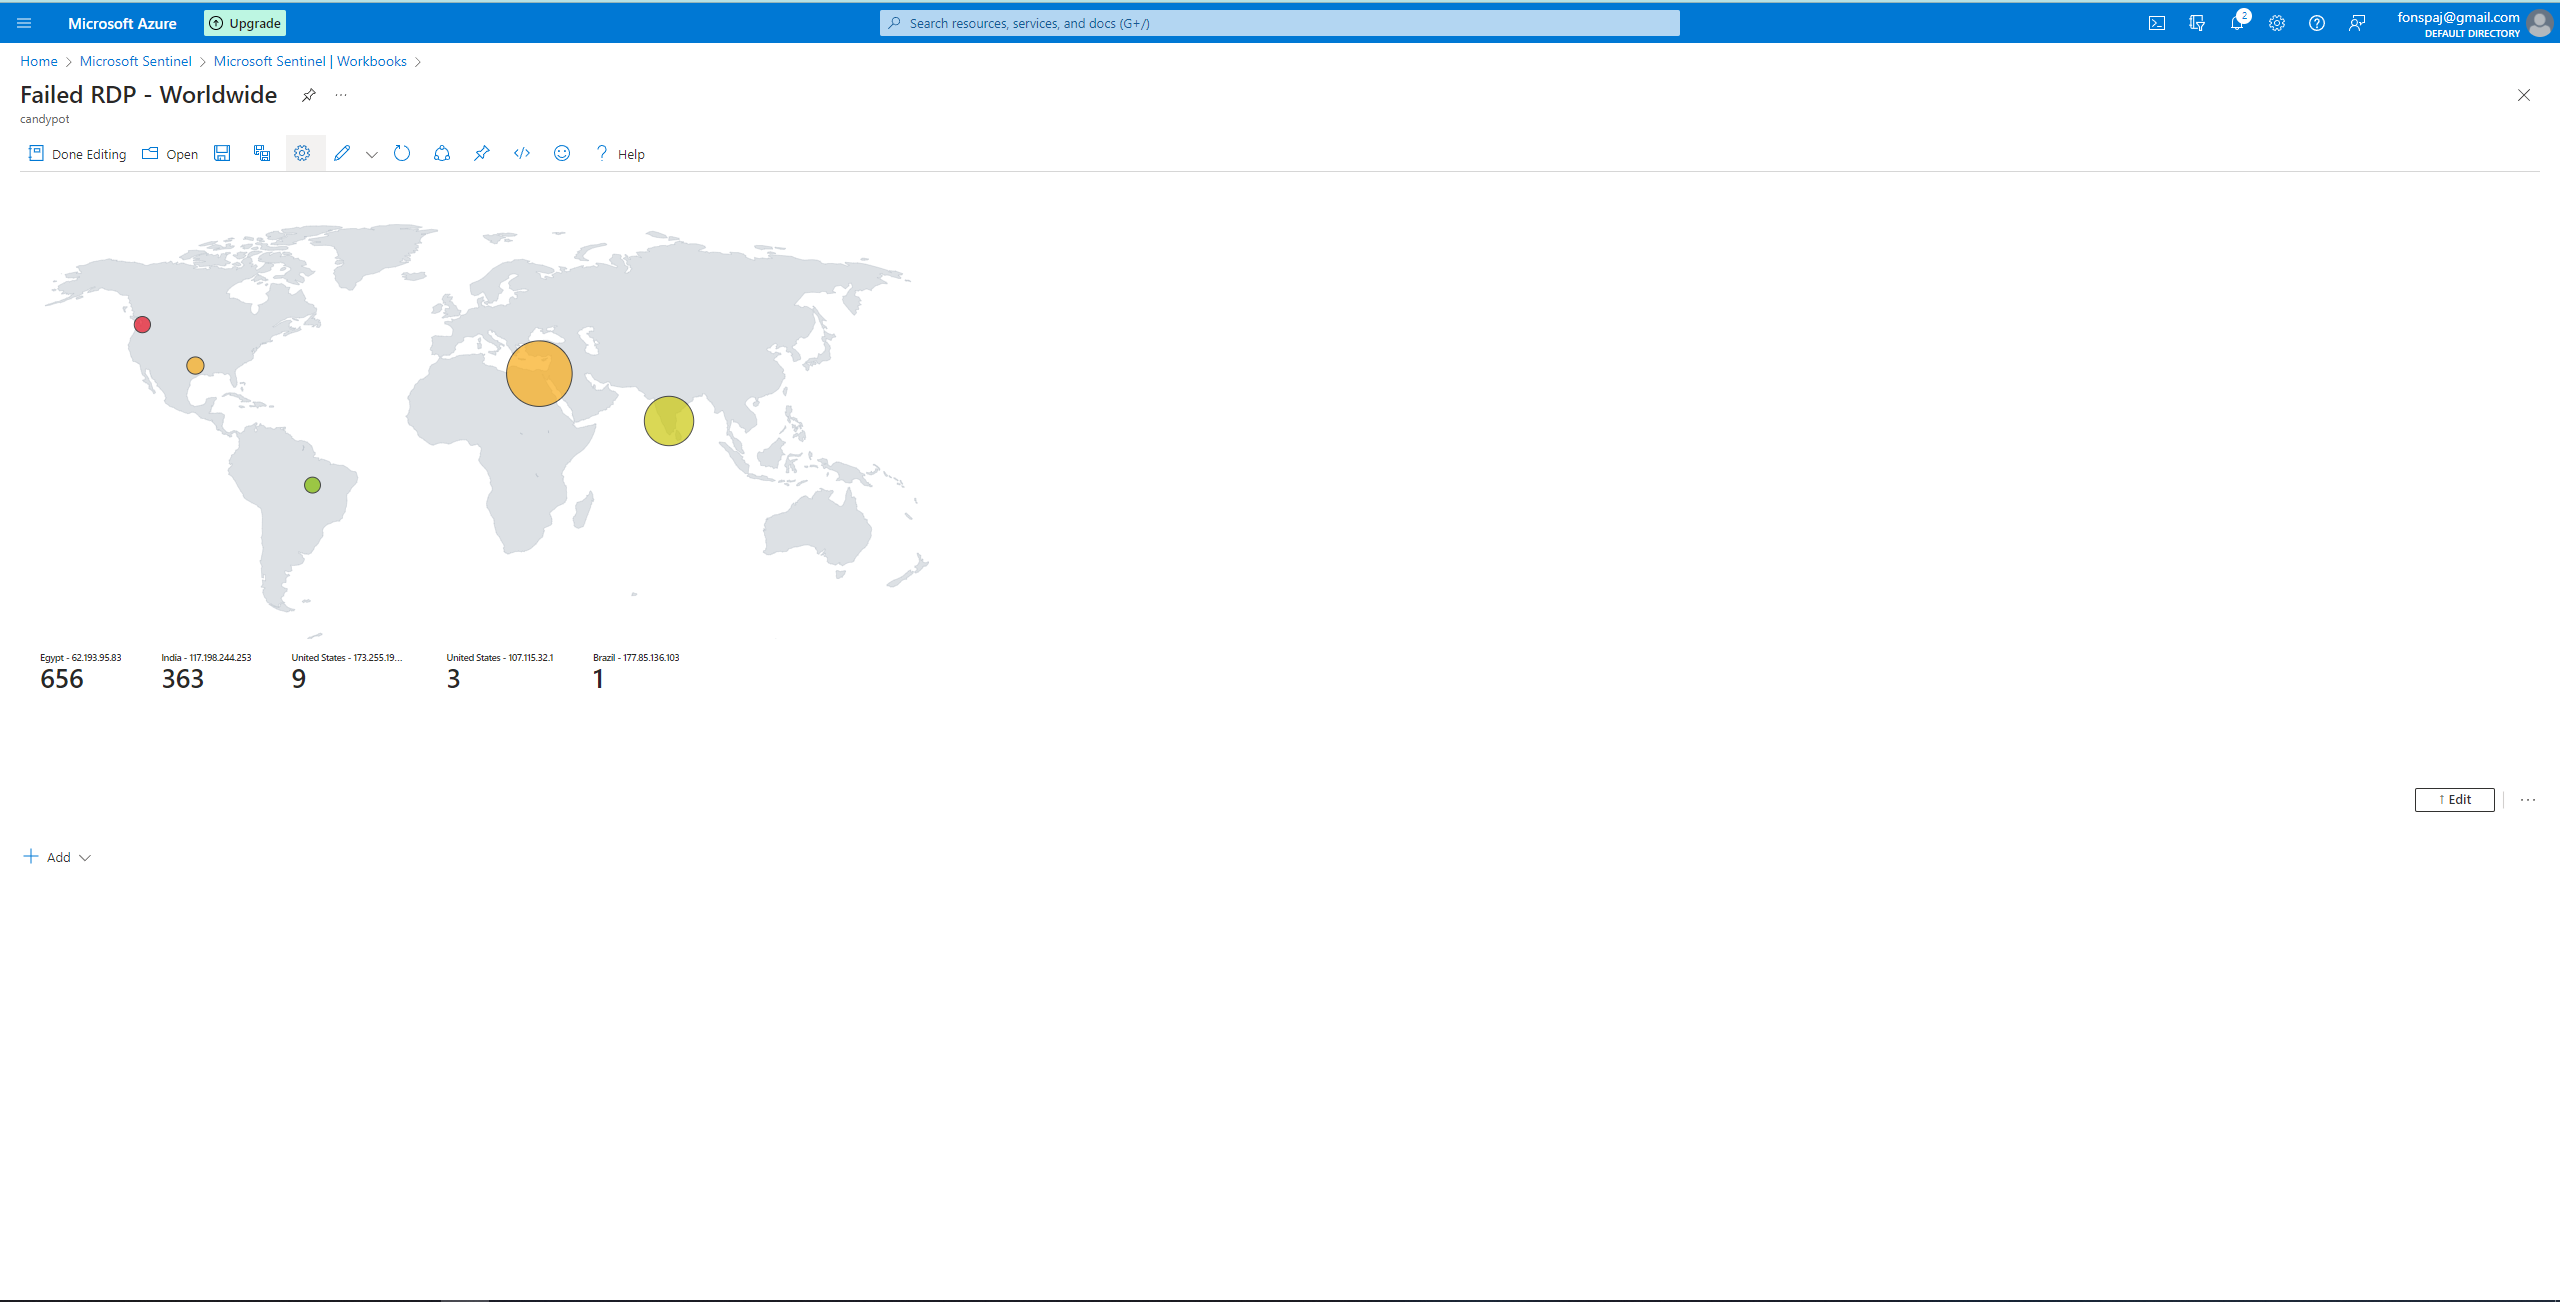
Sentinel’s Workbook Widget in Action
Start of Creation:
 Couple of Hours:
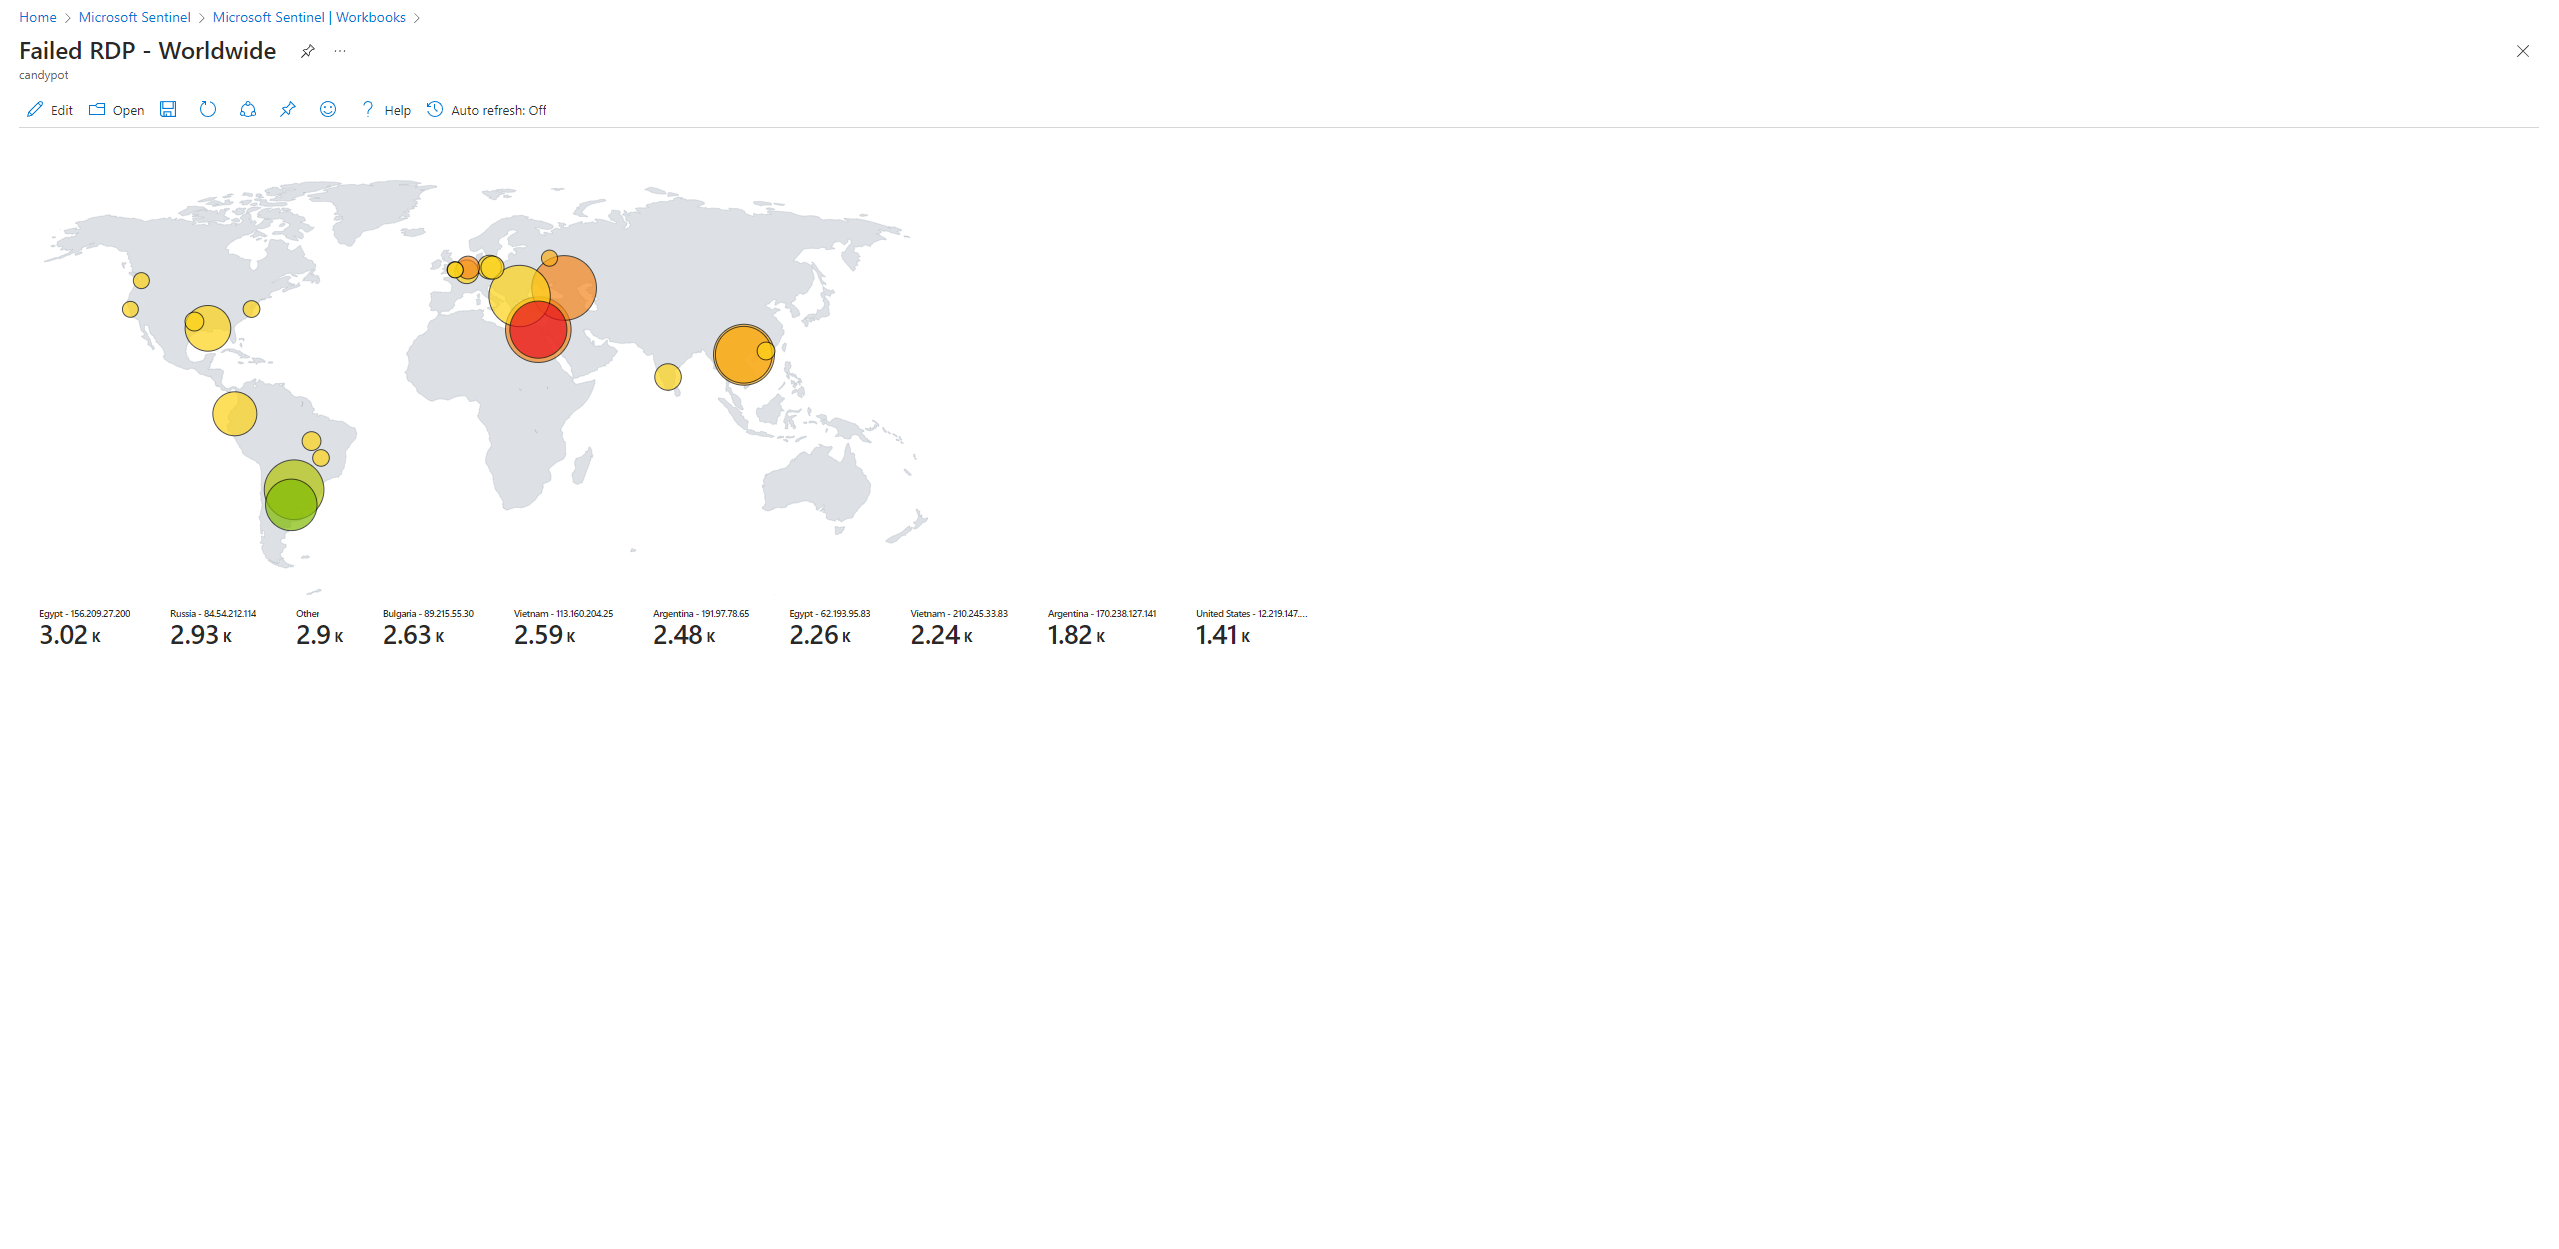
 In 1 day:
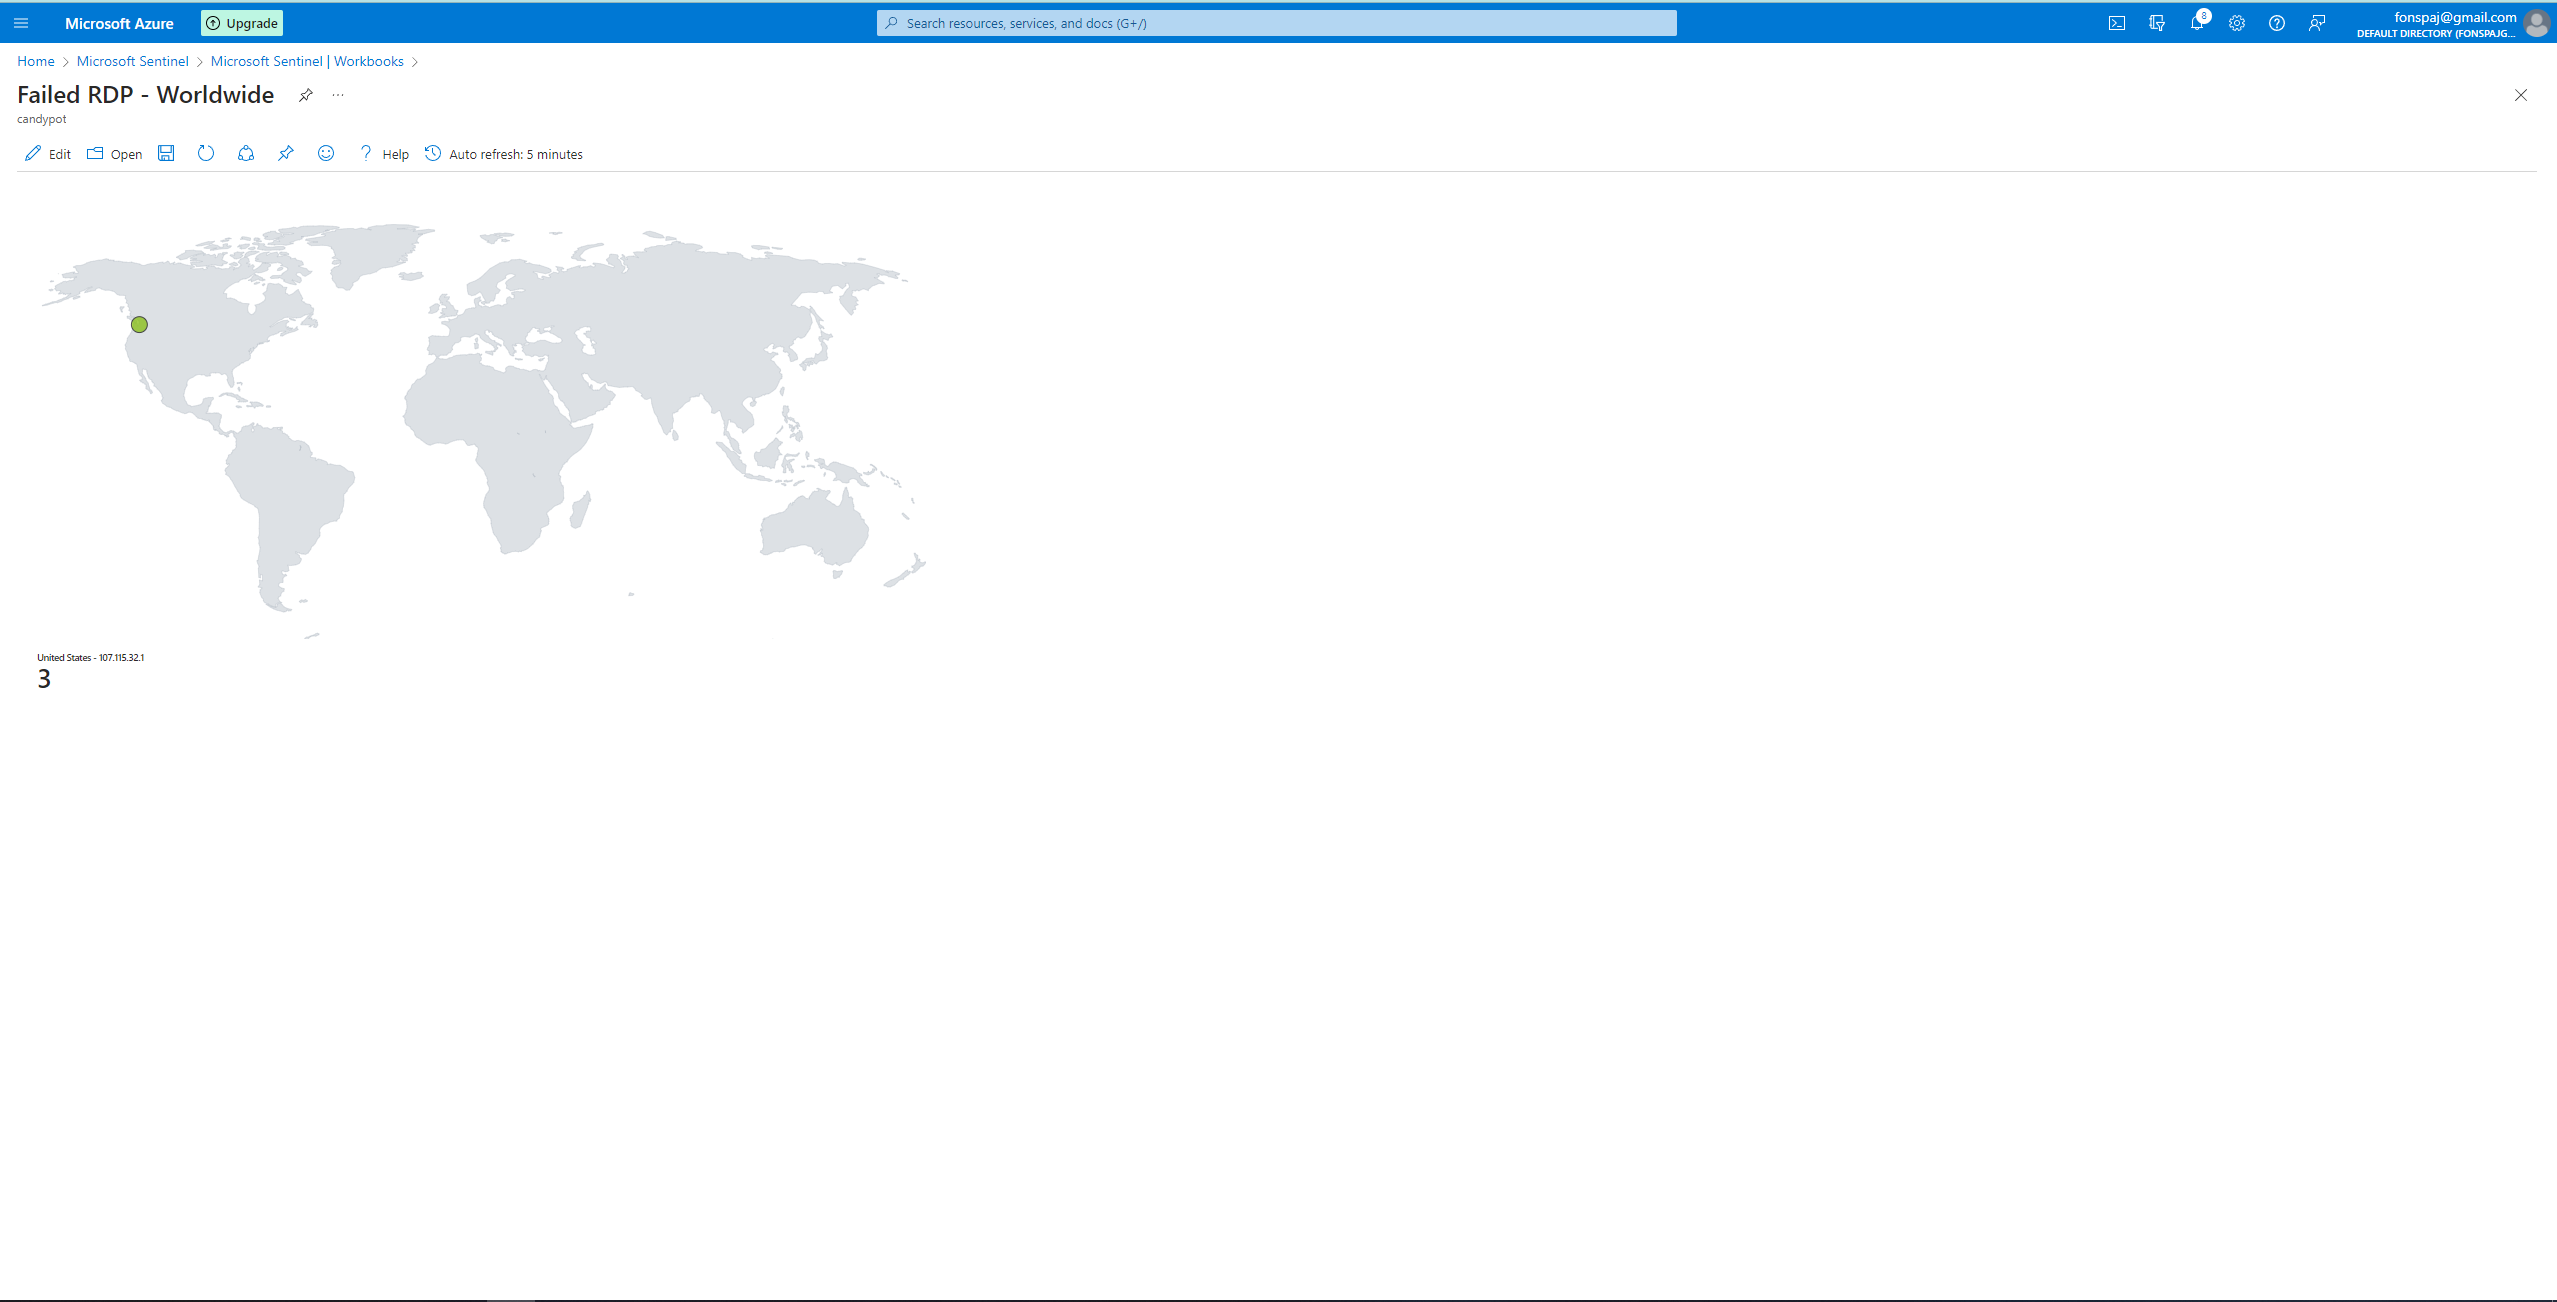
I created a Sentinel Workbook, removed the default widgets, and added a query widget. This widget will be a geo mapping of the logs. Edit the map settings using the custom fields: longitude, latitude, etc. Refining the map settings will improve the visual representation of what’s going on.
Overtime, different parts of the world were able to discover my VM and tried to brute force their way in. I can monitor who and where they are. I can also see which area is the source for the highest amount of attacks.
Follow Up
I will look into trigers and alerts and see how they’re able to interact with one another. For example, when a certain geographical location may attack the VM, I could be notified that it has occurred. This situation could mimic a scenario where defenders are trying to lookout and respond immediately to a specific event.